 Early land grants and patents become an important part of tree climbing. Understanding how to use the acreage involved will often make a difference in getting out the right branch. Also, placing various land grants together by associated surnames will help break down many brick walls.
The following pages show how this can be done using graph paper. [By now you should have bunches of this stuff!] Making a scale that can be used to give a general outline of a land amounts can be useful. The upper page is taken from an article written 1997 outlining the use of maps. It ends with the outline shown giving one square mile to every 640 acres of land. A line is then drawn showing that at 2 square mile = 1280 acres, 3 square mile = 1920 acres, 4 square mile = 2560 acres, etc., etc... If you have an ancestor who takes up a land patent of 4,000 acres, he would have a land area of six miles long and one mile deep, or any short of other combinations. If his initial grant was along one of the water courses marked by "mile markers", this would directly apply. [This was true of the first land grants in Virginia along the water highways!]
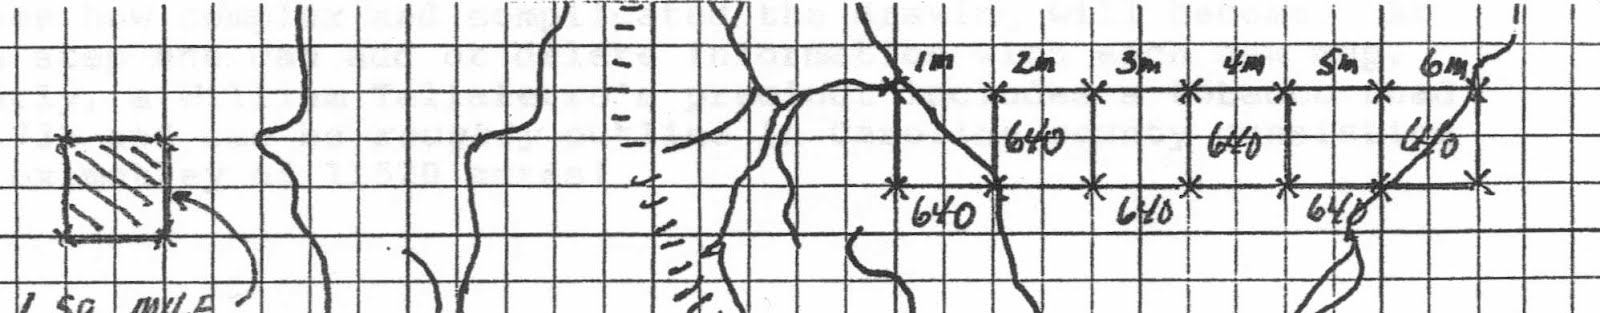
The figure to the right tries to show an enlargement of the graph which can be scaled to plot the grants as recorded. A beginning way to think about land grants!
Taken from: The Jones Genealogist, Vol. IX, No. 2, July/August, 1997, p. 4.
